
The chaotic days leading up to course enrollment are marked by students flocking to Carta, FastCourses and Edusalsa. These resources are filled with reviews, ratings, encouraging advice and cautionary tales for prospective class enrollees.
Until March 2020, students were able to inform their quarterly course selections through a valuable data point: grade distributions. However, in a decision that sparked mixed reactions from students, the University administration requested a take-down of these metrics from Carta. In this article, The Data Team explores trends in grade distributions across Stanford’s STEM departments. A deeper look into three STEM departments — chemistry, computer science and math — reveals vastly different compositions of grades. A near two-thirds supermajority of students receive A’s in CS classes, while almost half of the students in chem classes receive B’s. Furthermore, grades in upper-division CS and math classes are significantly more skewed toward the A range, as compared to introductory classes.
The raw data analyzed in this article was scraped from Edusalsa on Aug. 26, 2020 by Brian Su ’19. There is very little information regarding which quarters or professors the grade distribution data corresponds to, and as such, a University spokesperson could not confirm the data based on internal records. Furthermore, the data here is not nearly an exhaustive list of Stanford’s courses: Many popular introductory classes as well as more niche departmental offerings are missing from the dataset. Regardless, this data has sufficient breadth across departments and a large enough sample of courses and grades to extract interesting insights.
General STEM department trends
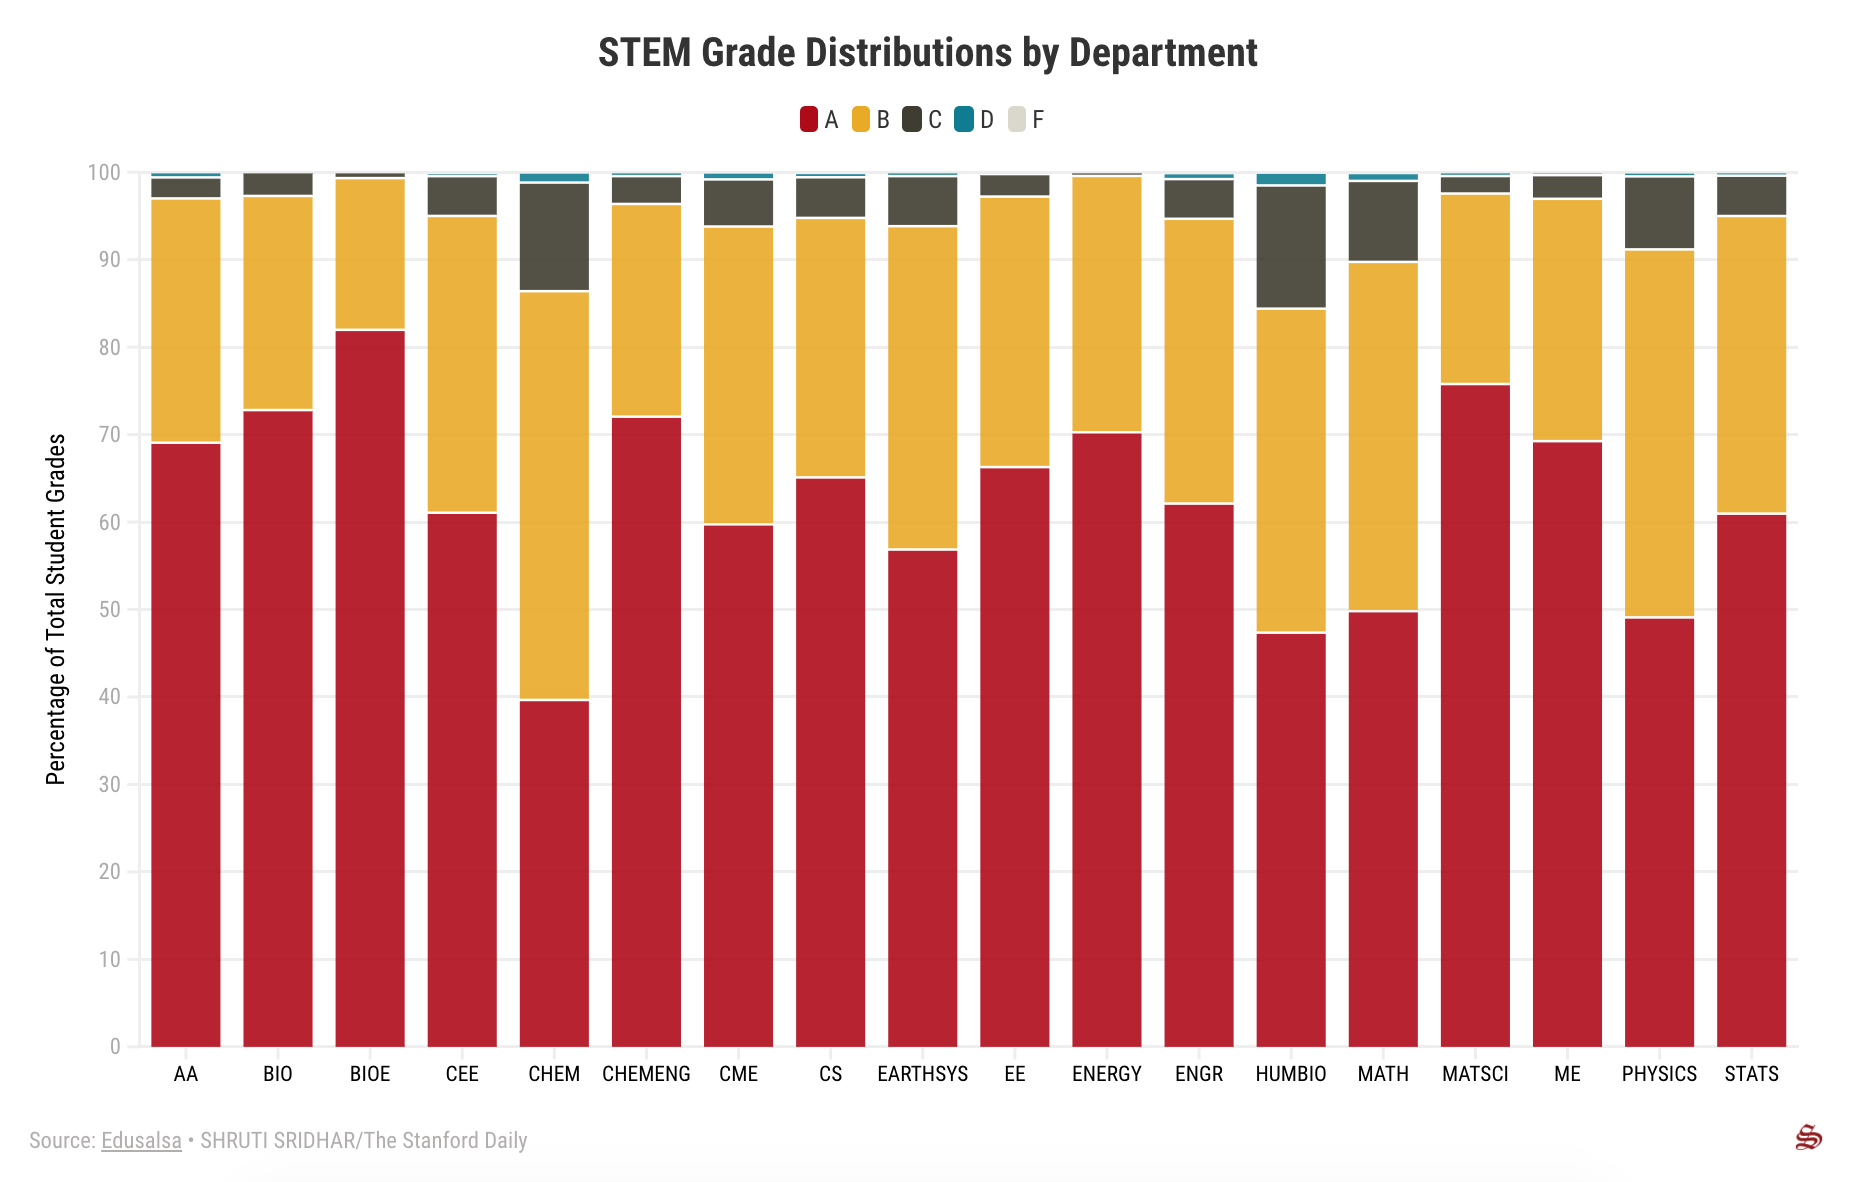
The following stacked chart visualizes the grade distributions of the STEM departments by percentage of the total grades in that field. Only departments with 10 or more course grades available were accounted for in the display. Percentages were derived from the aggregate amount of A’s, B’s, C’s, D’s and F’s across all courses listed for that department. Any satisfactory/no credit data was excluded.
Comparing grade distributions in chemistry, math, physics and computer science begins to unveil some notable cross-departmental patterns.
Across all chemistry course grades scraped from Edusalsa, 39.7% of students earned A’s, 46.7% earned B’s and 12.4% earned C’s. This marked the lowest recorded percentage of A grades across all departments in the dataset.
The math department’s grades clustered into 49.8% A’s, 39.9% B’s and 9.3% C’s. Physics department courses revealed an extremely similar distribution: 49.1% of students earned A’s, 42.1% earned B’s and 8.4% earned C’s.
In contrast, computer science, Stanford’s most popular major, boasted 65.1% of the students earning A’s, 29.7% earning B’s and only 4.7% earning C’s.
These four STEM fields attract hundreds of first-year students to introductory courses each quarter, whether to quench their curiosities, satisfy major prerequisites or both. Furthermore, these are some of the most popular departments in which undergraduates eventually pursue a major.
CS and math department grades by course level
According to ExploreCourses, there is no established course-numbering system across all of Stanford’s departments. However, in the CS department, courses numbered in the 100s are generally introductory classes for freshmen and sophomores. 200s courses are typically for advanced undergraduate and beginning graduate students. 300s classes are taken by advanced graduate students. 400s classes are experiment-based, and 500s classes are one-unit seminars for any student.
The chart below displays grade distributions within the CS department by course level. The dataset contained 32 courses in the 100s range, 25 courses in the 200s range, three courses in the 300s range and three courses in the 400-500s range.
For the CS 100s sequence, 63.2% of the students earned A’s, a proportion that ballooned to 73.1% for the 200s classes and 90.9% for the 300s classes.
In the upper-division 200s and 300s CS courses, which are presumably more challenging and specialized than introductory 100s classes, the grade distributions became increasingly skewed toward the A range. This correlation could denote that upper-division CS classes are composed of a more specialized group of students.
“I think [CS 106A and 106B] are mostly taken by people who are not yet declared,” said Adrian Liu ’20, a math and philosophy major and current Daily staffer who has taken CS 106B.
After CS majors declare their tracks, they tend to pursue 200s-level classes. Thus, the grade distributions become more skewed toward the A range as passionate, historically high-achieving students undertake increasingly complex CS material.
Julia Thompson ’21, a senior studying aeronautics and astronautics, has taken a number of chemistry, CS and math courses, both to fulfill her major and minor requirements and just out of curiosity. “All of the lower-level courses [that I’ve taken in these departments] had tons of students,” Thompson said.
She noted that these classes had “more students taking them as a requirement for pre-med or other STEM majors, rather than for that specific department.”
In the math department, there are two ubiquitous introductory sequences — the 20-series and the 50-series — along with upper-division 100s classes.
The Edusalsa dataset contained three courses in the MATH 20s introductory series, four courses in the MATH 50s introductory series and 18 courses across the range of MATH 100s courses. The grade patterns across these groups of math courses indicated a course level grade distribution trend similar to that found within CS.
For the 20-series (MATH 19, MATH 20, MATH 21), 38.4% of students received A’s; a near-majority of 47.9% students earned B’s; and 11.3% earned C’s.
For the 50-series (MATH 51, MATH 51A, MATH 52, MATH 53), a greater proportion of the grades were A’s at 48.4%. 40.9% were B’s and 9.8% C’s.
In contrast, the MATH 100s courses had 66.9% A’s, 28.1% B’s and 4.6% C’s.
In terms of class material, the “upper-level ones are harder,” Liu said, based on his experience taking the MATH 60-series and a number of 100 and 200-level courses.
The skew toward higher grades in these upper-division math classes, despite the increasing difficulty of their course content, potentially underscores a difference in the composition of introductory math courses versus advanced 100s classes.
“[The 20-series or 50-series] are taken largely by non-math majors, because of all the STEM requirements,” Liu said. While Liu didn’t take those classes himself, he noticed they’re “sort of in a different category” within the math department in that they are “geared towards non-majors.”
“All other classes are geared towards math majors,” Liu said.
This pattern of grades trending higher in advanced versus introductory classes aligns with Thompson’s experiences doing coursework in the chem department as well. “My grades were generally higher for upper-level courses than lower-level. The material was still difficult, but with smaller classes, more support and more experience in the department, I felt like expectations were clearer,” Thompson said.
The marked rise in CS and math grades from entry-level to upper-level courses might be inevitable, as a more specialized group of students — namely declared majors in those departments — tackle increasingly challenging material that they are passionate about. Going forward, it would also be interesting to consider how clearer expectations, lessened emphasis on testing and increased support in these upper-level STEM classes contribute to consistently high achievement, despite the uptick in content difficulty. Sticking it out through notoriously difficult entry-level courses may always remain a rite of passage for students majoring in these STEM departments. However, adopting some of the stress-reducing pedagogical tactics from upper-level classes could, if anything, avoid turning off students from a department altogether at the outset.