MATH 51 is a rite of passage for many Stanford students. And over the years, it has acquired a reputation as a challenging course (which may now be outdated given the major overhaul it has undergone). I took it this fall from my home in Bangalore, India. One obvious difference from the past quarters was the online experience, which got me wondering: What can data tell us about the student experience this quarter, compared to previous quarters?
Since homework makes up a fair chunk of the MATH 51 experience (and grading), over the holidays I reached out to my course instructor, Dr. Christine Taylor, who was able to provide me with anonymized homework data for the fall quarters of the 2019-20 and 2020-21 school years. The data showed the difference in submission patterns between online and regular sessions but it also revealed how a seemingly minor shift in homework deadlines substantially altered the submission patterns.
Of the 414 students who took MATH 51 in fall 2020, 20% opted for CR/NC. In fall 2019, 386 students took MATH 51 but only 9% of them chose CR/NC.
Somewhat surprisingly, the 2020 homework submission time trend is bimodal. The submissions peak minutes before the deadline, which is what one would expect. But there is a second, lower peak about 12 hours earlier. Fall 2019 shows a unimodal distribution with a single peak about nine hours before the deadline.

The best explanation I can come up with for the fall 2020 trend is that the homework was due at noon PT every Wednesday. I reckon many students sensibly opted to submit it the night before rather than spend the next morning battling their incomplete homework. For those halfway around the world, it would have made sense to submit it during their daylight hours.
This reasoning is consistent with the data for fall 2019, when all the students were in Pacific Time and homework that quarter was due at 9 a.m. on Wednesdays, meaning that most students were submitting close to midnight. Delaying the deadline by three hours in 2020 probably incentivized many students to tackle their homework in the morning, racing against the deadline. Dr. Taylor acknowledged that many students likely skipped the Wednesday 8:30 a.m. class to finish their homework in the morning and watch the video recordings later. I was enrolled in that lecture session and there was at least a 50-person drop in student attendance on Wednesdays.
The 2020 distribution tail shows smaller peaks, representing early submissions. These too have a periodicity of about 12 hours, likely dictated by the same logic operating in the previous days.
As the 2020 quarter progressed and student workload increased, more students began submitting their homework closer to the deadline, which caused the first peak to steepen and the 12-hour earlier peak to diminish. This is most clearly seen when comparing HW1 and HW9.

Both fall quarters saw more students submitting their homework closer to the deadline as the quarter progressed. In 2020, the 12-hour-earlier peak shrank, reflecting more students submitting just before the deadline. In 2019, by Week 9, a small second peak is seen just before the deadline. More students were pushing submissions to the last minute, braving the 9 a.m. deadline as a result of the increasing time constraints during the final weeks of the quarter.
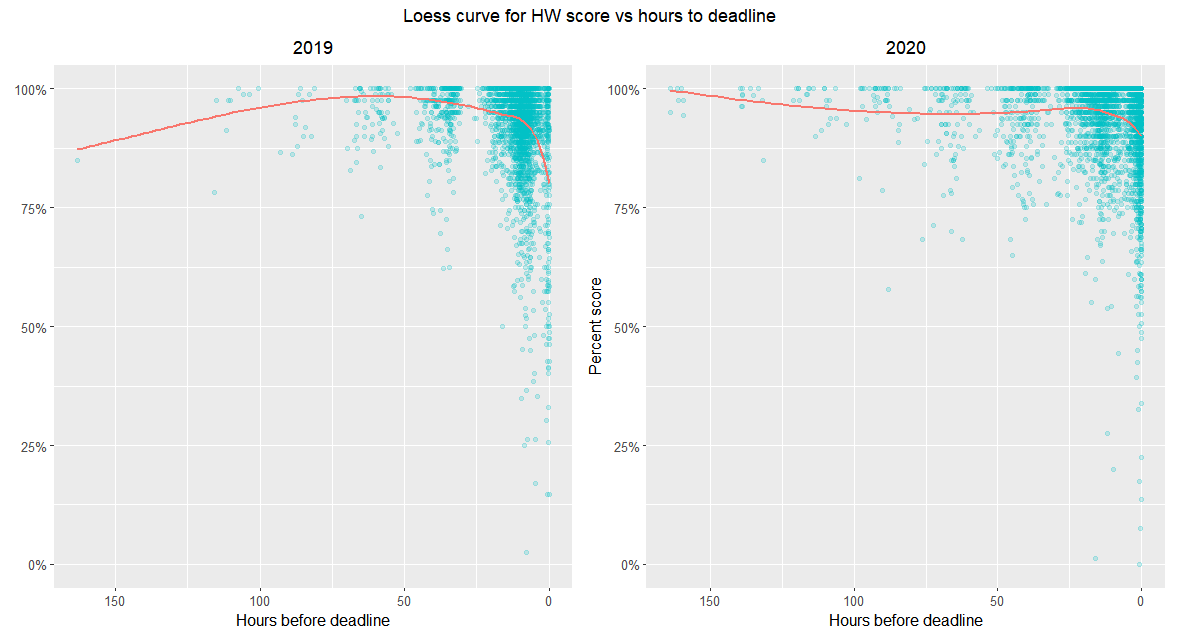
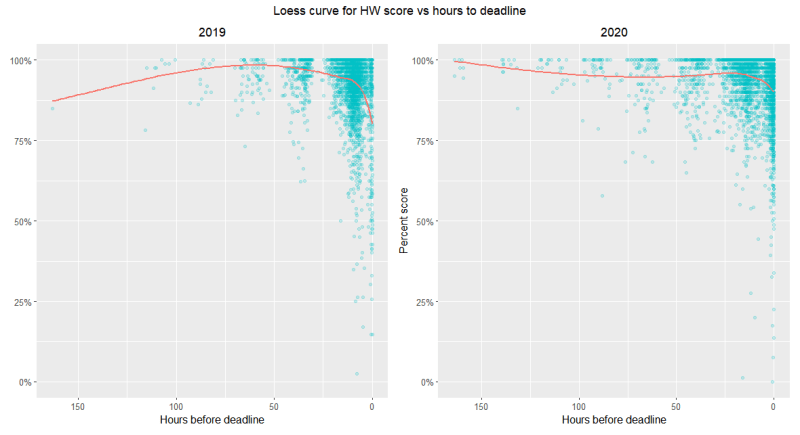
And now for the scores. It turns out that the scores received were largely independent of when the homework was submitted, as one would expect. But there was a noticeable correlation for those submissions made within the final approximately 30 minutes prior to the deadline. The closer the submission to the deadline, the lower the score was. The impact to the score was minor but statistically notable. Perhaps, this reflects scores of those who began working on their homework late and felt compelled to turn in by the deadline even if they hadn’t quite completed it.

Scatterplots look similar for 2019 and 2020, with clusters forming closer to the deadline and with scores above 75%. The loess curve (a regression method to fit a smooth curve through points) saw a sharper dip in scores during 2019 than 2020 (from 93.7% to 81.3% in 2019; 93.75% to 90.6% in 2020)
Plotting the average score and time to deadline for each student (thanks to Dr. Taylor, for suggesting this) gives a curve that is still pretty much flat until about 24 hours before the deadline, at which point there is a steeper drop. This suggests that students who habitually submitted closer to the deadline tended to have slightly lower scores.
When each student is represented as a datapoint, we obtain similar curves for 2019 and 2020 with a slightly higher drop in scores in 2019. (90% to 67.5% in 2019 and 95% to 87.5% in 2020.)

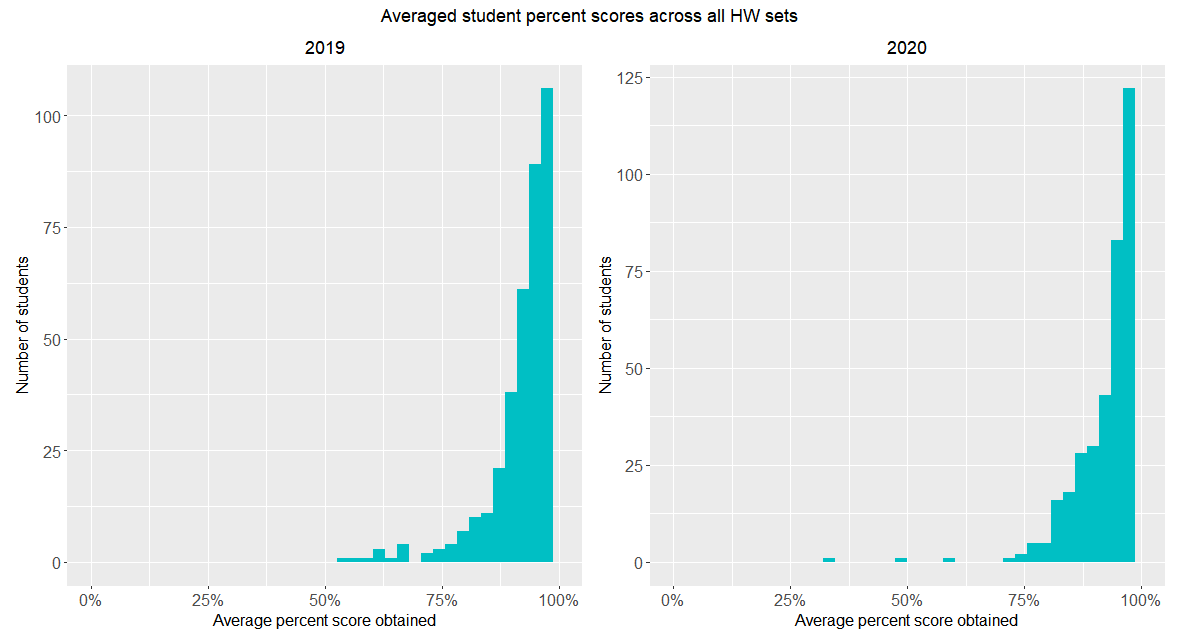
The homework score distributions for both fall quarters look almost identical. The problem sets were slightly different, suggesting that the difficulty-level of the homework was consistent across the two quarters. (Here I am making the reasonable assumption that the student populations were statistically indistinguishable).

Of course, some humility is called for when analysing such formal tallies. Correlation does not necessarily imply causation, as the cliché goes. When trying to explain aggregated data, we have to bear in mind that the constituent data points reflect choices made by individual students to optimize for their personal goals based on their own specific constraints. We could let this humility stop us from trying to fit the collective data to a common narrative. But where’s the fun in that?
Please contact Niveditha Iyer at nivsiyer ‘at’ stanford.edu.
