The Stanford Hospital system continues to play an important role in the Bay Area’s response to the COVID-19 pandemic. As of May 26, Stanford Medicine has tested more than 50,000 unique individuals. Of these tests, roughly 3.5% — 1,739 in total — have come back positive.
Scientists agree that the rate at which tests come back as positive is an important signal of how communities are faring and is crucial to identifying and controlling the spread of the virus.
“We would certainly like to see countries testing at the level of 10 negative tests to one positive, as a general benchmark of a system that’s doing enough testing to pick up all cases,” said Michael Ryan, executive director of the World Health Organization Health Emergencies Program in an interview with NPR. Similarly, the U.S. Centers for Disease Control and Prevention (CDC) guidelines state that maintaining a positive test ratio of ten percent is critical to support the U.S. COVID-19 response.
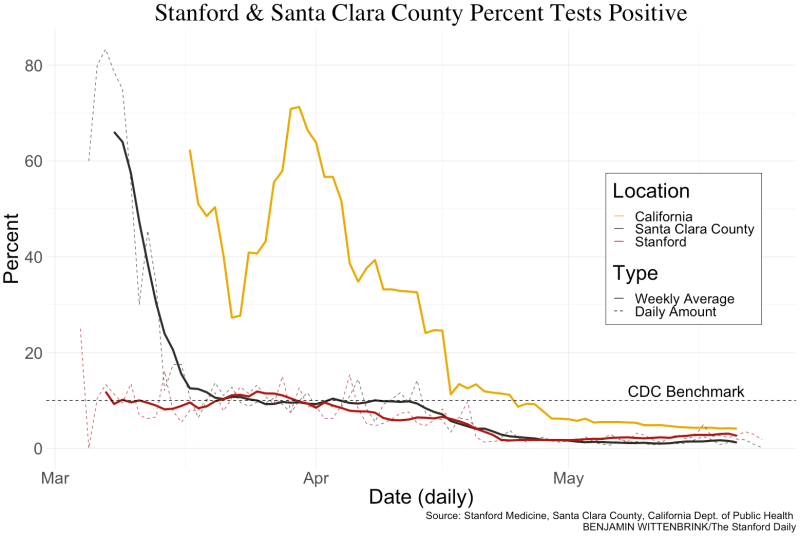
At Stanford Hospital and in Santa Clara County, the percent of total tests that are positive is well below 10% and has been decreasing over the past two months, likely as a result of the county lockdown and an increasing testing capacity. In the past week, the percent of positive tests per day has hovered around 1-2%, as shown in the plot below.
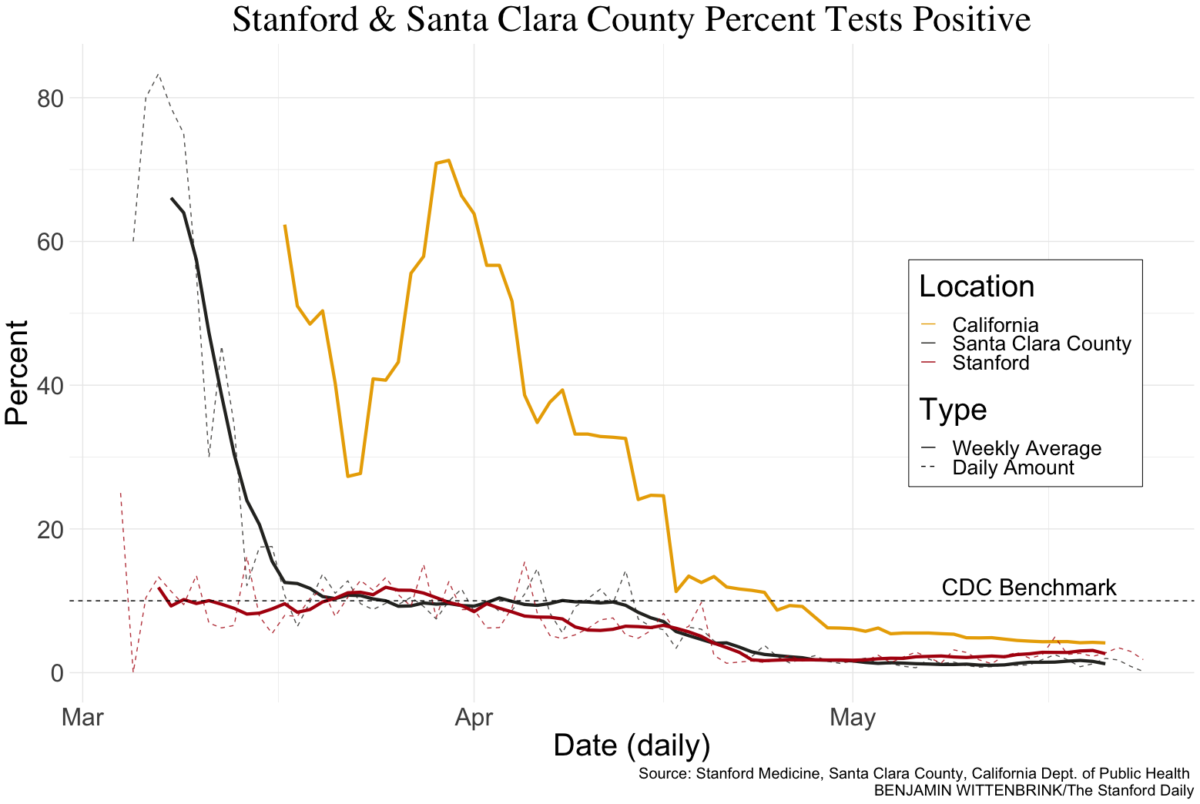
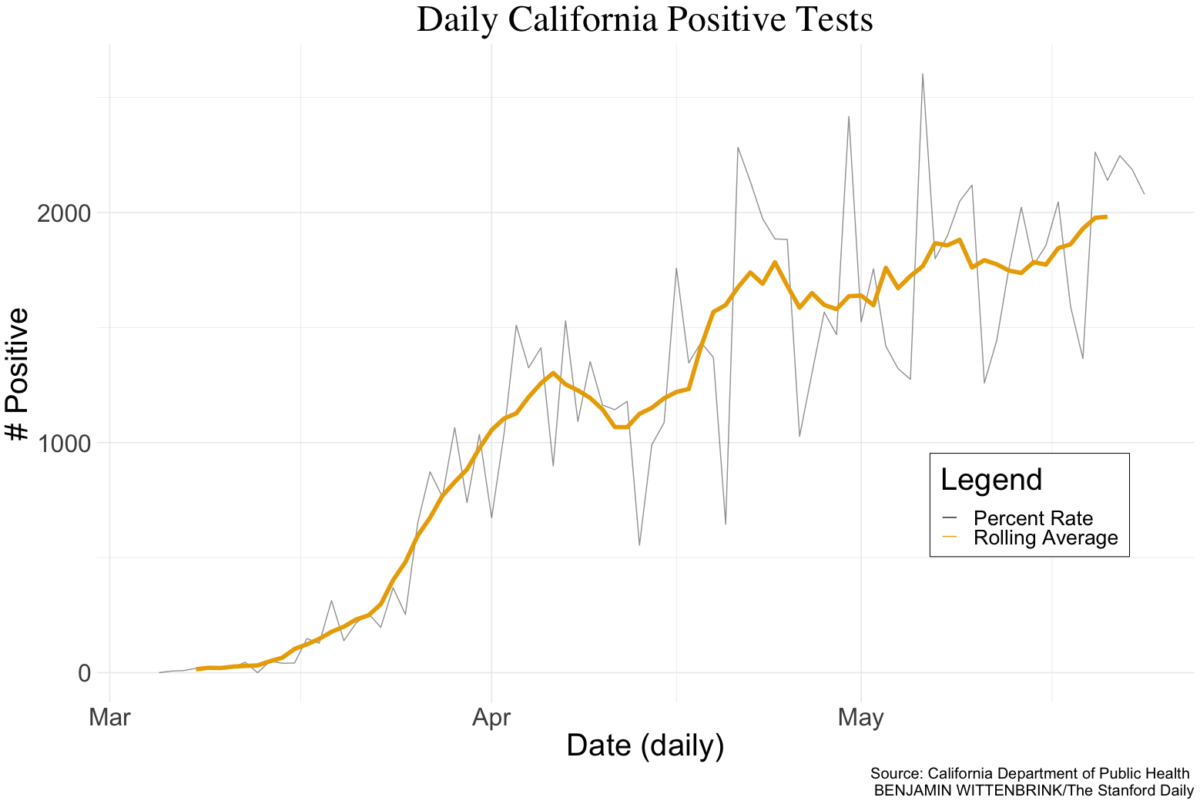
COVID-19 statistics collected by California’s Department of Public Health in Santa Clara County exhibit a similar downward trend. Averaging a rate of roughly 10% for early April, the percent positive rate has since fallen to an average of 1%. At the state-level, although spiking in mid-April, California has averaged a positive test rate of 4% over the last week. California and Santa Clara County trends are both shown in the plot above. A more in-depth look across the Bay Area can be found here.
As of May 18, 98 COVID-19 patients have been hospitalized at Stanford Hospital. A quarter of these patients have required an intensive care unit (ICU). In the week leading up to May 18, only six patients have been hospitalized, with two receiving ICU support. As of May 26, only 54 COVID-19 patients were currently hospitalized in Santa Clara County, down from 100 a couple weeks ago. Unfortunately, more recent data is not available for Stanford hospital, though the trends in Santa Clara County suggest that new hospitalizations at Stanford Hospital are likely also slowing. Despite concerns of overloading the health care system, 50% of acute hospital beds and 42% of ICUs remain available in Santa Clara County while 90% of ventilators are not in use. None of Santa Clara’s 1,231 surge beds are currently in use either.
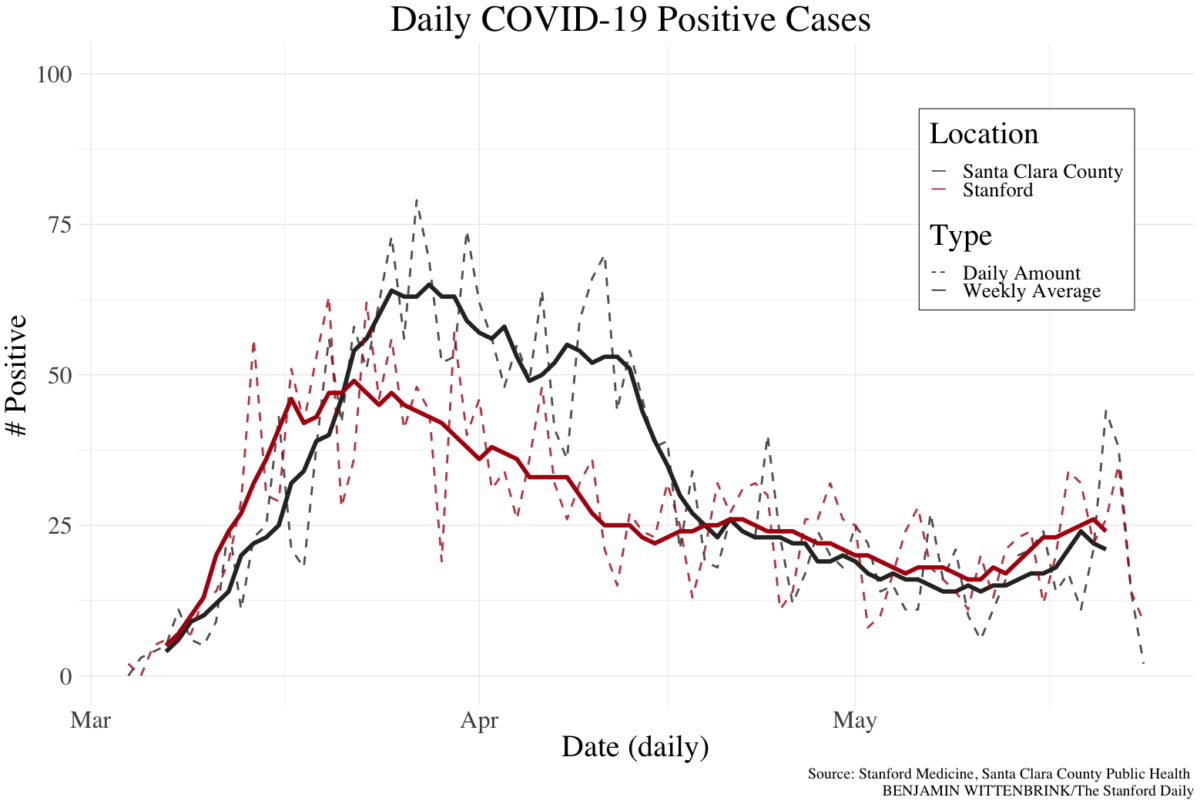
In addition, the absolute number of unique positive cases per day has remained relatively constant since late April at both Stanford Hospital and in Santa Clara County. Unique positive cases grew rapidly in March and peaked in early April. However, there has been a slight uptick in positive cases in the last week, potentially related to the relaxing of restrictions. This may be further compounded by the fact that values for the most recent five days will likely increase as additional results are received. It is too early to tell whether this is simply an anomaly or indicative of an increasing trend once again. Nonetheless, these figures demonstrate a steady decline in positive cases in both locales relative to the heights of late March.
As unique positive cases fall, testing capacity continues to increase. Over the past week, Stanford Hospital has tested an average of just under 1,000 individuals per day while Santa Clara County has tested approximately 1,500 per day. Researchers at Harvard’s Global Health Institute have suggested that the bare minimum for the United States to begin opening up is 500,000 tests per day. With a population of 2 million, this suggests Santa Clara should be testing a minimum of 3,000 individuals a day before relaxing restrictions. The county unveiled a new, less invasive COVID-19 test on Friday, in efforts to increase its testing capacity to 4,000 per day by the end of the month.
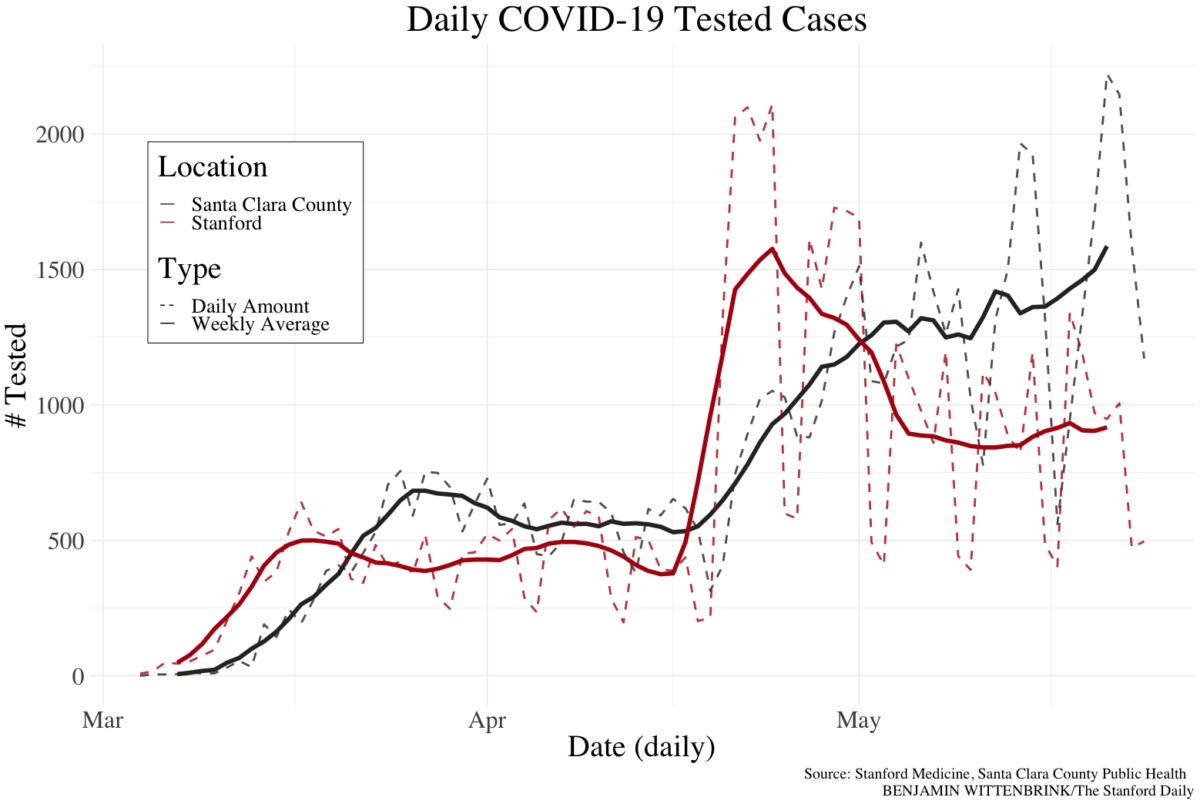
Caution should be taken when comparing the absolute numbers of tested and positive cases reported by Santa Clara County and by Stanford Hospital as the underlying populations for the two entities are likely different. Saurabh Gombar, clinical instructor at Stanford Hospital, has been maintaining Stanford’s COVID-19 data and confirmed that Stanford Medicine’s statistics include all “the unique patients that had testing regardless of where they lived.” Importantly, this includes specimens that were collected at external facilities and clinics that have subsequently been sent to the Stanford Hospital system for processing. In contrast, according to the Santa Clara County Public Information Officer, Santa Clara’s figures represent “all cases tested in Santa Clara County.” As a result, these two numbers measure an overlapping but not identical population. This helps explain why — especially early on in the crisis — Stanford Hospital processed more unique specimens than Santa Clara County.
Despite the declining trends, Santa Clara County only officially entered Phase 2 of Gov. Gavin Newsom’s multi-phased plan to reopen California on May 23, significantly later than the other Bay Area counties. Whereas Phase 1 is targeted toward making workplaces safe for essential workers, counties in Phase 2 are scheduled to reopen retail businesses and manufacturing. As the county made the announcement, Santa Clara County Public Health officer Sara Cody ’85 said the county’s efforts had been successful in flattening the curve, as testing numbers were up and COVID-related hospitalizations were down.
However, the declining trends at Stanford Hospital and in Santa Clara County do stand out in comparison with California and the rest of the country. Although California has weathered the crisis fairly well relative to other states — with only 97 deaths per million population, a third of the U.S. average, and 2,525 cases per million population, half of the U.S. average – positive cases are still increasing.
Some additional statistics (as of May 28):
- The racial disparities in COVID-19 positive case rates are also apparent in Santa Clara County. While white residents make up 32% of the population, they only make up 17% of cumulative cases. Meanwhile, Latinx individuals make up for 40% of cases while only 26% of the population. Note that the county reports 16% of cases as “Unknown” race/ethnicity, so the other race/ethnicity percentages could vary greatly.
- Santa Clara County has seen 140 COVID-19-related deaths. 60% of deaths were male, and 89% of all deaths had comorbidities.
- According to Santa Clara County statistics, the Stanford zip codes 94305 and 94309 make up for fewer than 20 cumulative cases. The hardest hit area in the county continues to be the most urban: San Jose.
See the code for this piece’s visualizations at The Daily’s Data Team GitHub. For more data journalism on COVID-19 in the Bay Areas, see The Daily’s other coverage here. The Stanford statistics and more can be found at Stanford Health Care’s “Stanford Virology Lab COVID-19 PCR Statistics” webpage. This site is updated daily and open to the public. Statistics for Santa Clara County can be found at the county’s Data Dashboard and a cleaned version of the data can be found at the Stanford Open Data Portal. State-level and national numbers can be found at The COVID Tracking Project.
Contact Benjamin Wittenbrink at witten ‘at’ stanford.edu.
