One of the core functions of student government here at Stanford is facilitating student-initiated programming on campus. In particular, there are hundreds of “voluntary student organizations,” or student-led groups, that put on hundreds of events each year. The Graduate Student Council, the graduate student arm of the ASSU, funds these events each year with money collected through the ASSU graduate student fee (currently $24 per quarter).
All of this funding information is publicly available upon request (or through attending the open funding meetings). However, in light of the upcoming ballot request to raise the ASSU graduate student fee and also in keeping with the spirit of transparency that all student governments should strive towards, I have compiled a brief overview of the last 10 years of this spending here (over $1 million) and developed an easy-to-use web interface for exploring the data.
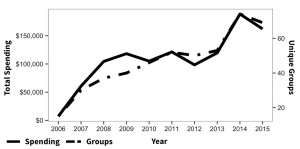
As can be seen in the figure below, over the last 10 years, there has been a significant increase in student group spending (solid line). Excitingly, this rise in spending has been matched by an increase in the number of different groups requesting funding as well (dotted line), suggesting that as spending has increased, a more diverse set of student groups has been provided access to funding. This rise in spending for the last two years is not sustainable with the current ASSU fee, though, and has mostly been funded through one-time transfers of funds from the graduate student government’s “rainy day” fund. If we as a community want to continue to support an increasing number of groups each year, then measures like the proposed ASSU fee increase on the ballot this quarter are necessary.

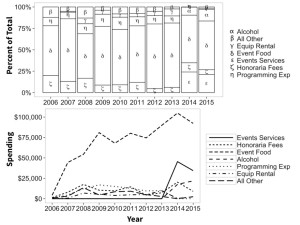
We can also look at what type of spending has been most dominant over time, as shown in the figure below both as a percent of total spending (top) and as a raw amount (bottom). As you might expect, the largest expense is the food served at events. It’s important to note here that in 2014, two major changes were that many spending categories were consolidated into “Events Services” and alcohol became a separate category from event food. Even accounting for category consolidation, there has been a slight overall increase in spending on event service-type items in 2014-15 (~23 percent) compared to 2012-13 (~17 percent).

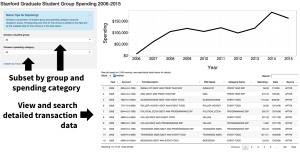
These high-level observations only scratch the surface of what could be learned from this data, however, so I encourage any interested readers to explore the data for yourself using the online tool available here and outlined in the figure below.
The online tool allows you to look at spending broken down by both individual student groups and spending categories. In addition, you can view and download the data selected for further analysis. Transaction information includes the date of the transaction and if it was spending external (APTRX) or internal (SUJE) to Stanford.
Hopefully, in the future, peer institutions’ student governments will also make their data easily accessible, allowing for cross-college comparisons of spending trends over time. This online database is just one step towards increasing overall accessibility and transparency.
– Trevor Martin
Contact Trevor Martin at trevorm ‘at’ stanford.edu.
